🚨 The 20 Types of Bullsh*t You'll See at Work.

Bullsh*t at work comes in many different forms. Sometimes it's simply embellishing or sugarcoating gone too far. Sometimes there's half-truths. And then sometimes there's just plain old misrepresentation.
Today, we'll talk about 20 examples of how bullsh*t manifests itself at work.
📑 Table of Contents:
- #1 Designing flawed systems.
- #2 Creating false dilemmas.
- #3 Conveniently ignoring the counterfactual.
- #4 Treating noise as signal.
- #5 Fixating on sunk costs.
- #6 Cherrypicking.
- #7 Measuring growth dubiously.
- #8 Making claims off of biased samples.
- #9 Over-using corpspeak and euphemisms.
- #10 Anchoring, maliciously.
- #11 Using misleading visuals.
- #12 Misusing regressions.
- #13 Extrapolating run-rates dubiously.
- #14 Distracting with edge cases.
- #15 Lazy thinking.
- #16 Long sentences to appease everyone.
- #17 Over-extrapolating with anecdotes.
- #18 Writing "fake" strategies.
- #19 Using the wrong measures of success.
- #20 Using "fake" scientific assumptions.
📍 #1 Designing flawed systems.
I often receive newsletter emails that end with an ask for user feedback at the bottom. Unfortunately, they're often designed like this:
😠🙁😐😀🥳
Here's the issue: this is a flawed design. Only people who have a disproportionately positive opinion will take the time to submit feedback.
Meanwhile, those who find it mediocre will not waste their time even clicking. And even if they want to provide feedback, they certainly won't click on the angry- or sad-looking emoticons.
I mean, when's the last time you got "angry" or "sad" at a newsletter? It simply is not designed to capture constructive feedback.
And that is how people end up claiming near-100% satisfaction rates for their newsletters.
📍 #2 Creating false dilemmas.
Here's an underrated question you want to ask yourself often:
"Why can't both be true?"
You see, storytelling is often about simplicity, and simplicity often comes from polarity and trade-off's. Unfortunately, this also tends to lead to bullsh*t.
For instance, consider the following claims:
- "If we trust our employees, why must we track what they work on?" (unfortunate side note: I've actually heard a senior colleague say this.)
- "If we want to invest in emerging markets, why are we worried about short-term ROI?"
- "If we want to foster a transparent culture, why aren't we sharing financial projections with everybody?"
- "Revenue as a metric does not accurately represent the value of this product to the wider company – so we should not be tracking it."
False dilemmas create illogical premises and artificial trade-offs. They then lead to unproductive discussions and potentially dangerous outcomes. Try to spot it when it happens.
And often, your best response is to simply say: "Both can be true."
📍 #3 Conveniently ignoring the counterfactual.
To think about the counterfactual is to think about incrementality. But there is often an attempt to ignore the counterfactual and take credit for non-incremental outcomes.
For instance, consider the following claims:
- I joined Google in 2015. Since then, I have helped the company's stock price more than quadruple.
- I started cheering for the Boston Red Sox in 2003; due to my fandom, they proceeded to win the World Series in 2004.
- We increased our marketing budgets by 10% this year; as a result, our sales doubled vs. last year.
Statements #1 and #2 are obviously ludicrous.
But you hear #3 all the time at work. Why?
📍 #4 Treating noise as signal.
If you want to get deep into this – it never hurts to brush up on the concept of statistical signifiance.
The idea is actually quite simple: for a given signal, you’re simply trying to gauge how likely it is to be random noise. But to do that, you need to get a sense of how much things fluctuate "normally."
Only then can you gauge how "abnormal" (and therefore how meaningful) the signal is.
For example, imagine that we saw that product sales this week went up by 5% vs. last week. Pretty impressive, right?
The answer is probably yes if sales tend to only fluctuate by +/- 1%.
The answer is less clear if sales easily go up and down by 10% on any given week.
So the next time someone brings you a shiny number ("Our sales went up by this much...") and tries to tie it to their efforts ("...because we did these things") – try to figure out if you're looking at noise or signal.
(For more examples on this topic: see here.)
📍 #5 Fixating on sunk costs.
Sunk costs are costs that have already been incurred. They should not affect how you make future decisions, especially if you're thinking on the margin.
But sometimes they do. And you need to call it out when you see this fallacy at play.
For instance, imagine that the team has invested heavily in a new product for 3 years – but everything suggests that it will not be the growth engine we had expected it to be.
The sunk cost fallacy will then lead people to make irrational decisions – since they've "invested so much" on it already. For instance, they might not say it – but they will be highly reluctant to pull the plug on the product, even when it's the right choice.
Call out the sunk cost fallacy when you see it – and save others from sinking further.
📍 #6 Cherrypicking.
Cherrypicking is easy to understand – but hard to spot when there is information asymmetry.
For instance, consider cherrypicked stats in a basketball context:

Fine, the oddly specific metric cutoff points sort of give it away.
But imagine that you're an investor, and someone comes to you with the following quarterly snapshot of their business:
- Revenue and profits from our top 10 clients are up
- Churn rates have gone down by 10% on average
- Average basket sizes in emerging markets have increased by 5%
At a glance, this is very much a rosy picture. But you need to push yourself to ask more questions to ensure these aren't deliberately cherrypicked stats. For example, you might ask:
- What do growth rates look like for the middle quartile of our portfolio?
- What do churn rates look like for our most profitable client segment?
- What is happening to repeat purchase frequencies?
- How are average basket sizes trending in mature markets?
Not falling prey to cherrypicked stats is hard, especially without a deep understanding of the subject matter. Here are some questions to aid you when these is information asymmetry?
- What are the northstar metrics you track?
- How do you usually segment your portfolio?
- How does the performance of metrics vary by segment?
- What is the logic behind your measurement thresholds?
📍 #7 Measuring growth dubiously.
Business is all about growth – but not everyone measures it the right way.
There is no one single right way to measure growth – different situations call for different yardsticks. But you need to know that when someone says "growth ," it can mean any of the following:
Comps Growth
Generally used in retail, comps = comparable same-store sales. For instance, to measure the comps growth of your restaurants this year, you would not factor in the sales from newly opened stores.
Simple Pre/Post Growth
Simple and straightforward. For instance, you might choose to simply measure your store's sales growth vs. the prior week, month, or quarter. However, this is not always informative, because...
Year-on-Year Growth
...not accounting for seasonality means that you are measuring biased results. No one would simply compare the sales from Black Friday week vs. the week prior and claim this year's promotion was a success. Instead, comparing against the same period a year ago tends to be the easiest way to control for seasonality.
"Uplift"
This is where it gets hard (but interesting). To measure incrementality, you cannot simply measure "before" and "after." Instead, you need to measure the growth (or lack thereof) in a proper control group – and compare the difference. Only then are you measuring uplift.
So the next time you see someone come to you with a shiny case study claiming that a particular action led to some kind of growth – ask them what kind of growth they mean.
And ask them why they chose to measure growth that particular way.
Often, asking these 2 questions alone tells you all you need to know about the robustness of the claim.
📍 #8 Making claims off of biased samples.
Extrapolation is helpful. But it needs to be apples to apples. Once in a while, however, you see instances where people fail to consider how representative their sample size is. This then leads to highly inaccurate conclusions.
For example:
- Conducting a survey online, yet not realizing that the extrapolations only apply to people with internet access (by definition)
- Testing a new product feature within the company, only to realize the insights do not apply to 99% of users in the market.
📍 #9 Over-using corpspeak and euphemisms.
Bullsh*t is not just about bending the truth. It's also about obfuscating your true intentions and desensitizing people. For instance:
- We didn't fire people or lay them off. We merely rightsized the organization and conducted a reduction-in-force exercise.
- We didn't adjust our strategy because it wasn't working out. We simply made a strategic pivot and sharpened our problem statement.
Sometimes this is harmless. But sometimes the most harmless things are the most dangerous.
📍 #10 Anchoring, maliciously.
Anchoring is not necessarily bullsh*t – it's actually a useful tactic – but when it leads to anchoring bias, it can be used to exacerbate the effects of bullsh*t.
For instance, imagine that you are negotiating with a colleague on how long it'll take for her to send you a report she's on the hook for. She might suggest initially that it will take 3 weeks, but then offer to reprioritize her projects and come back to you with a more accurate estimate.
The next day, she shares the good news: she has found a way to get it done in 2 weeks.
Smart, but maybe not malicious. Just like when a real estate agent shows you a house way out of your budget first – suddenly, a house slightly over your budget doesn't seem that daunting by comparison.
But sometimes anchoring is done maliciously to bend the truth – and that is completely unacceptable. Look out for it.
📍 #11 Using misleading visuals.
Misleading visuals can lead to dangerous (and wrong) conclusions. If it is intentional, it is akin to lying. Here are some common examples:
- Using concentric circles to show market share – which inevitably makes the share look bigger than it actually is
- Using axes that are way too zoomed in (or out), thus leading to over-amplification (or over-compression) of trendlines
- Using non-zero baselines for axes, thus rendering changes to look more dramatic than they actually are
A good visual can help amplify a strong story. A misleading visual, even if unintentional, can seriously harm your credibility.
📍 #12 Misusing regressions.
As the saying goes, a little knowledge is a dangerous thing.
Here’s a real example I encountered at work a few years ago.
One day, I found out that a neighboring strategy team developed a regression model to predict the revenue trajectory of their business unit. Below is an illustration of what I figured this team wanted to achieve:
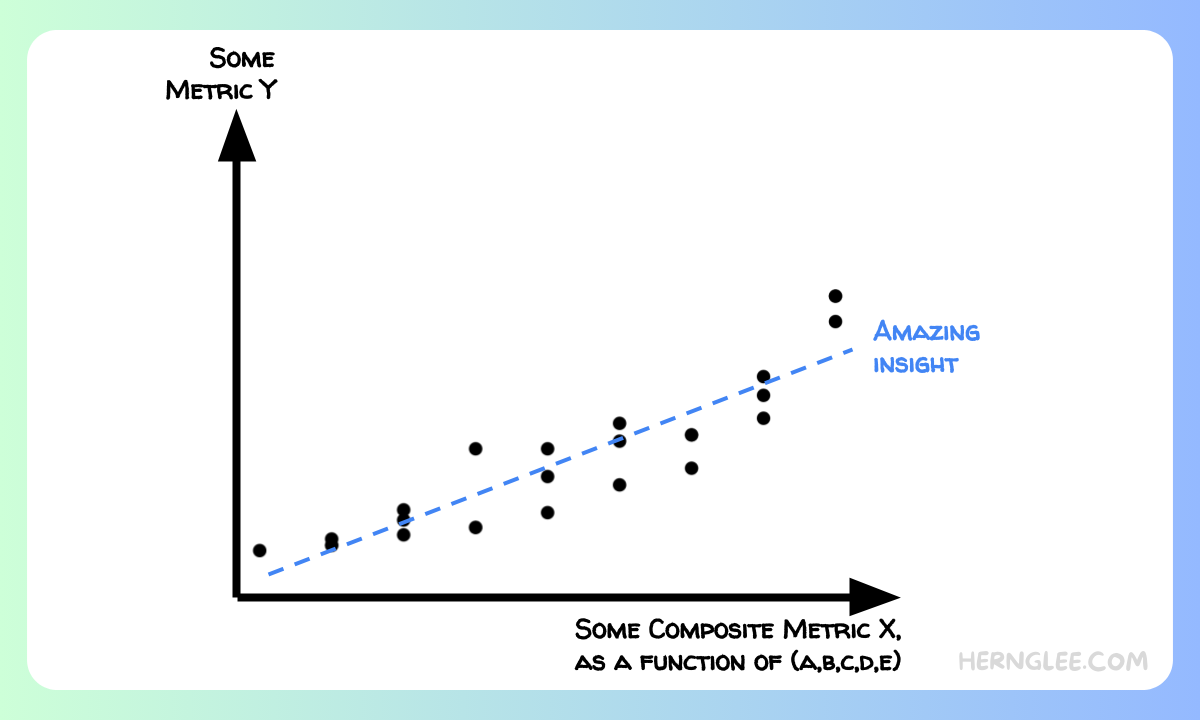
In reality, what they ended up developing resembled something more like the below:

Immediately there were a few troubling issues.
The first was the implied correlation on the chart: I hesitated to conclude that there was any meaningful relationship at all.
The second was the limited number of datapoints and the force-fitted trendline. Another huge red flag.
The third was the R Squared on the chart: while I appreciated the transparency, the fact is that most people simply do not know how to interpret it properly. It is hard to determine what is considered good, what is considered bad, and what is…inconclusive.
Instead, it tends to just create more confusion, or worse yet, a false sense of precision.
📍 #13 Extrapolating run-rates dubiously.
If you see someone citing annual run-rates (ARR), make sure you ask a couple follow-up questions, such as:
- What period is the ARR extrapolation based on?
- What does the distribution look like across customer segments?
- How much seasonality is there usually?
Let me be clear: there's nothing wrong with annualized numbers and making comparisons easier. Just kick the tires to make sure it's done with integrity.
📍 #14 Distracting with edge cases.
Bullsh*t isn't always just about misleading. It's also about distracting and wasting time.
So when you see people taking the group down a rabbit hole – call it out and get the group back on track.
For example, imagine that your team has developed a budget allocation framework – but due to data limitations, it does not apply to 2 small countries, out of the 100 countries your company operates in.
Sure, someone can always challenge the model by claiming it doesn't work universally, and ask the team to go back to the drawing board again.
Or you can recognize that this is nothing more than a distraction, and gently push back.
📍 #15 Lazy thinking.
Not all bullsh*t occurs in the form of numbers. Fluffy language and generic platitudes can do plenty of harm as well by creating a false sense of direction. When this happens, it is lazy thinking at its finest.
Lazy thinking can manifest itself via the following:
- A slide that has a few pretty boxes filled with buzzwords — but no mention of what resources will be required, who will be accountable, and what the measures of success will be.
- A bullet point that has no subject and/or no verbs. The writer alludes to a theme but refuses to define who will be doing what (and how). You do not know if they’re betting the house on it, or if they are just trying to keep the lights on. Or somewhere in between.
For instance, when someone says their strategy is to deepen partner relationships next year, ask them what they really mean. You do not let them get away with a simple phrase on a simple box.
Instead, you challenge them. You ask them what personnel adjustments this will entail. You ask them what resources this will require. You ask them what deepening actually means. And you ask them how they plan to measure how deep is deep.
You challenge them until they can articulate their actual strategy instead of hiding behind buzzwords. You are not satisfied until they can tell you something to the effect of:
…by saying “deepening partner relationships,” I mean I’m going to redeploy 20% of my team’s bandwidth to focus on developing case studies with existing partners, while also carving out budget for monetary incentives to drive a couple northstar metrics for us.
📍 #16 Long sentences to appease everyone.
Over my many years of doing strategy work at Google, I've noticed a curious phenomenon.
You see, Google is a big company, and people do a lot of things. And when it comes to writing strategy documents or team priorities, no one wants to feel left out.
As a result, strategy-writing sometimes becomes an English exercise, where people attempt to write one-sentence mission statements that contain every buzzword, qualifier, and allusion possible. Just so no one feels too left out.
That's not strategy. That's just a long run-on sentence.
There's no prioritization without deprioritization.
📍 #17 Over-extrapolating with anecdotes.
Jeff Bezos has said something along the lines of:
The thing I have noticed is that when the anecdotes and the data disagree, the anecdotes are usually right. There is something wrong with the way that you are measuring it.
Fair enough. But we're not Jeff Bezos. And most of us aren't running Amazon. So be very careful when someone attempts to use "Well my personal experience was different..." as a way to reject what the data is saying.
Pursue the lead and see where it goes – but don't let it undermine the foundation of good data and measurement.
📍 #18 Writing "fake" strategies.
A "fake" strategy = cool-sounding blobs of text that provide neither actionability nor accountability. A fake strategy does not help deliver business outcomes.
Don't fall into the trap of writing "fake" strategies (or let others get away with it).
(Instead, this is how you should be thinking about writing your next strategy document.)
📍 #19 Using the wrong measures of success.
Business in its simplest form is about inputs and outputs. You put in a quarter, and out comes a piece of candy.
If you're not measuring or incentivizing the right things – you won't get the candy you need. Yet people measure the wrong things all the time.
For example, your goal is to launch a new consumer-facing product this year. Should you focus on measuring:
- The number of feature updates?
- The turnaround time to fix bugs?
- The number of new sign-ups?
- The user churn rates?
- The in-app engagement duration?
- The in-app spend levels?
Some of these metrics are likely more important than others, as they are more akin to output metrics. But this is not to say that input metrics are meaningless: not everything on the output side is within your control, and you need to design incentives accordingly. It's all about the right mix.
So when people show you what they're measuring: ask them what they're trying to incentivize. And ask them what they're optimizing for.
📍 #20 Using "fake" scientific assumptions.
All models are wrong; some are useful.
However, be very careful when you look under the hood of certain models.
For instance, imagine that we are trying to estimate the market potential for a new product launch. The logic then goes:
- We know the addressable user base, based on demographic data (this is reasonable)
- We know how much an average customer is willing to spend, based on internal and external benchmarking (still reasonable)
- We then assume we can get 1% of the market – and voila! We now have a sense of our revenue opportunity. And we were being conservative! (this is where the logic breaks down)
You see, there's no science behind the 1% figure. It just feels small – based on nothing but finger in the air.
But that is not how business works. You cannot simply find a big addressable pie, and claim that you can easily lay claim to 1% of it.
All models are wrong, but some are useful. That being said, make sure you kick the tires extra hard when people bring you estimates – things are often a lot uglier under the hood than we'd like to believe.


